Overview
Have you ever stared at a map and felt that pull of adventure, like it is whispering secrets about far-off trails? That is exactly what will strike you if you lay your eyes on a detailed Kanchenjunga Trek map. Looking at the map, you realize that it is not just any hike. Rather, it is a rugged loop around the world’s third-highest peak, Kanchenjunga, towering at 8,586 meters in eastern Nepal.
Spanning 220 kilometers over some 23 days, the Kanchenjunga Circuit Trek climbs to a maximum of 5,065 meters. A thorough reading of the map reveals that strong fitness and respect for altitude are essential to excel in this adventure.
But let’s be real: Without a good Kanchenjunga Circuit map, even the most prepared trekkers could end up second-guessing every turn in those remote valleys.
Therefore, a good understanding of the Kanchenjunga Trek map is essential to make this journey doable. You find diverse variations of trek maps — from the simple standard topographic maps to the polished visual ones from Radiant Treks. The standard maps may be printed versions with 1:50,000 scale sheets. Or they could be handy apps such as Gaia. They lay out contours, rivers like the Tamor and villages with raw precision.
But Radiant Treks’ visual route map stands apart from the standard version. It is more like a blueprint of a full-color adventure. The map features markers for everything — from footpaths and jeep tracks to base camps, health posts and accommodations. And they are easy to read, as well.
The map is not just functional. It makes planning the Kanchenjunga Circuit Trek an exciting experience. Whether you are a solo explorer or joining a guided group, maps like these turn potential pitfalls into confident strides.
Highlights
- Visual maps are ideal for referring to clear route lines, icons and altitude charts of the Annapurna Circuit
- Maps help you visualize every climb and descent, making navigation straightforward
- Standard topographic maps have detailed contours for terrain pros
- Visual version of the map adds quick-reference icons
- Journey through the trek’s phases using the map as a guide, revealing the scenery and trekking strategy
Are you planning trekking in Nepal? Do you need any information? Let us know via form below, we are happy to help.
Key Elements of the Visual Map

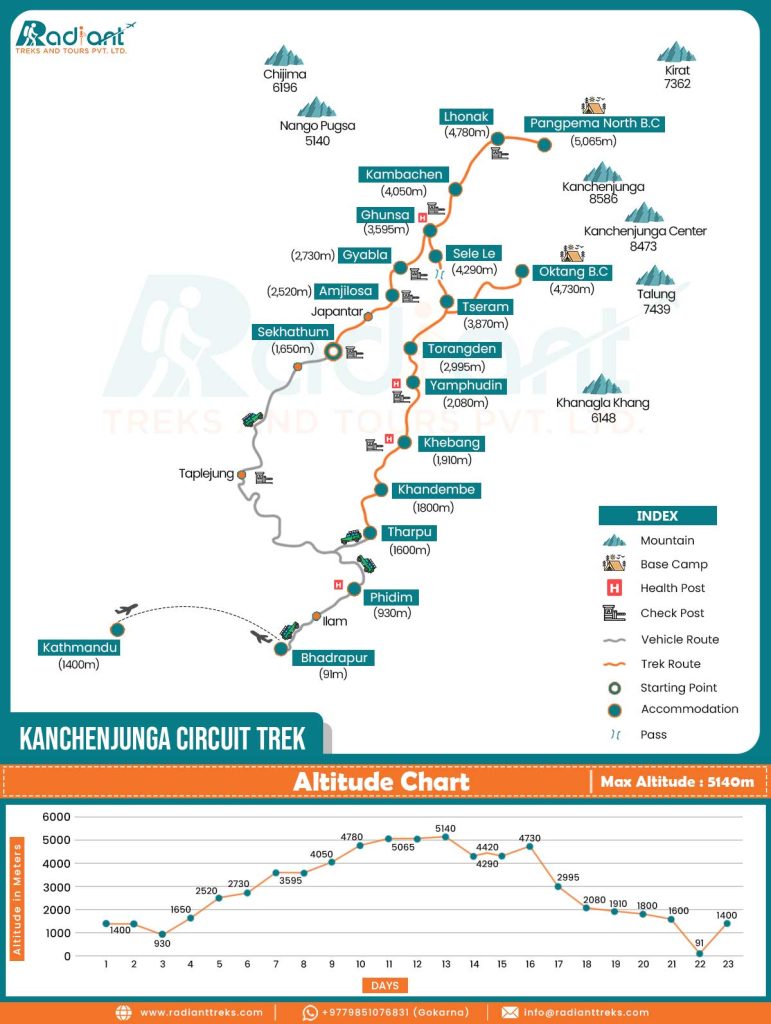
The visual route map of the Kanchenjunga Circuit trek prepared by Radiant Treks has a clean design and an inviting layout. It serves as an essential tool for trekkers. It has the main schematic, a stylized outline of Nepal with the trek route highlighted in a bold orange line. There are icons, precise altitude details and a practical chart as well. All these factors enhance your planning and navigation. Thus, the visual route map is an indispensable companion for turning trek aspiration into reality.
Here is a brief discussion on the map’s key elements:
Route Path and Transportation
At the top of the Kanchenjunga Circuit Trek map, you have got the main schematic — a stylized outline of eastern Nepal with the trek route highlighted in a bold orange line. But before that, a gray dotted line wiggles from the journey’s starting point, which is Kathmandu airport at 1,400 meters. It shifts from Kathmandu to Bhadrapur, marked with an airplane icon to indicate the flight segment. Then you see a gray line along the vehicle route to Phidim and Sekhathum.
From there, the line turns orange and solid for complete trekking sections. The line goes north to the heights, up to Pangpema. It is the North Base Camp of the Mt Kanchenjunga. The same orange line descends back south and reaches Oktang, the South Base Camp.
Icons and Symbols
What really hooks you to the Kanchenjunga Circuit map are the icons placed at various points along the map. They are simple but accurate.
Mountain: It highlights notable peaks near the trekking trail. Kanchenjunga is shown with a symbol of a mountain. So is the case for Kirat and Talung peaks.
Tent: This icon flags the base camps. Pangpema gets a prominent tent icon near the northern tip, and Oktang sits proudly on the southern arm.
Teal blue dot with orange: This symbol marks accommodations. They pop up at villages like Ghusna and Tseram, among others, helping you to picture those cozy teahouse nights after a long day on the trek trail.
H: The health posts along the Annaourna Circuit Trek route are marked by ‘H’ in a red background. It reminds you where to head if altitude sickness affects you. In the route map, you can see these symbols, starting from Phidim. There is one in Ghunsa, Yamphudin and Khobang.
Security booth: There are symbols of a security booth in different locations, indicating the permit check posts along the route. You encounter the first one in Taplejung, then in Sekhathum, followed by Amlijosa, Gyalba, Lhonak along with Yamaphudin and Khemabg.
White dot encircled by teal blue line: This marks the starting point of the trek and you can see one at Sekhatumn, the ultimate point of the beginning of your journey on foot.
Reversed parentheses: The symbol that looks like parentheses reversed in blue color indicates the pass that you will find during the trek. There is one such place marked with the pass icon on the Kanchenjunga Circuit Trek map. That is to denote the existence of the Sele La Pass.
Altitude Labels and Waypoints
The map also has every major waypoint marked with an altitude label. It is written either below the name of the place or next to it. Take an example of Lhonak at an altitude of 4,780 meters or Yamaphudin at an elevation of 2,080 meters.
These numbers are not just statistics. They are also a roadmap to pacing yourself during the trek. Looking at these elevations on the map will keep you from pushing too hard and too soon when on the trek.
Altitude Chart
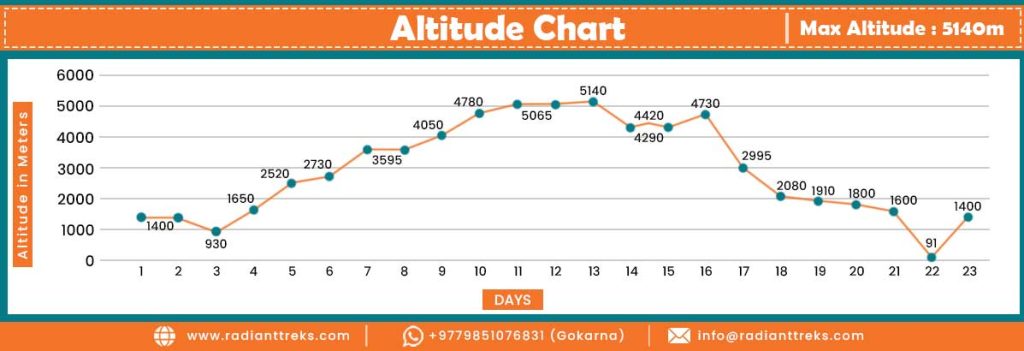
Then there’s the genius addition of an altitude chart at the bottom of the map. It’s a line graph stretching across the trek’s timeline. It starts low around Day 1 in the subtropical lowlands and ramps up steadily. You’ll see spikes around Days 10-15, hitting that 5,140-meter max at passes like Sele La. Then the trek eases down in the final stretch.
Day markers align with typical itineraries. As a result, you can spot where the big gains happen. One of such elevation gains is from Ghunsa to Kambachen. That knowledge allows you to plan acclimatization accordingly.
Readable Map
There are numerous perks of the Kanchenjunga Trek map and one of them is that it is super readable. Even if you are not a map expert, you can decipher the codes and symbols of this route map with ease. The colors and symbols make sense at a glance.
You can print the map for your backpack or load it digitally for offline use. It means you need not fumble with apps in zones with spotty internet signals.
Likewise, if you are customizing your route, those map labels let you tweak your side trips. Therefore, having this readable map with you means being with a silent guide who is whispering about the route along the way.
Comparing Kanchenjunga Trek Maps

You can refer to a variety of maps to explore the Kanchenjunga Circuit. Regardless of their type, each brings something different to the table. Based on their diverse forms, here is a brief discussion and comparison of them with the visual map of Radiant Treks.
Detailed Topographic Map
The original or standard topographic maps have been the go-to for years for good reason. These are the classics with detailed sheets and scales like 1:50,000 from reliable sources. Even apps like AllTrails and Gaia have digital layers, similar to the printed ones.
Either digital or print version, they are packed with contour lines every 40 to 100 meters. They sketch out the steepness of slopes and valleys with mathematical precision. Mighty rivers like the Tamor snake through in blue. Villages and trails are generally labelled plainly. Likewise, you get hydrological details that help spot potential water crossings or flood-prone areas.
These maps’ strength lies in the fact that they provide in-depth information on the trekking route for serious planning. If you are an experienced hiker, then those contour lines let you calculate gradients. That is useful for estimating how grueling a day’s climb might be.
The digital maps integrate seamlessly with GPS tools, allowing you to overlay your position for real-time tweaks. These are useful in off-trail moments caused by weather or landslides.
Visual Route Map
The Radiant Treks’ visual map is an enhanced companion that builds beautifully on the aforementioned foundations of the topographic map. It takes the core topographic essence but amps it up with the color-coded routes and icons that reveal key features of the trail.
Base camps get tent markers and accommodations show as blue dots, turning abstract lines into reference points. Similarly, the altitude chart adds a narrative flow as it graphs your journey’s highs and lows.
Which is the Best?
Rather than choosing only one version of the Annapurna Trek map, it is better to use both options. That is because together they shine brightest. For instance, if you are preparing for a fogy pass crossing, then the standard map’s contours help assess the slope’s severity. Meanwhile, you can refer to the visual icons for flagging nearby health posts or scenic points for breaks.
Likewise, in a real scenario, when you need to adjust for heavy snow, then you might cross-reference the original’s detailed elevations with the graph of the visual map. This will help you reroute safely if needed.
As a result, this combination of both maps boosts safety and fun. The standard maps are best for the nitty-gritty, while the visual route maps are to elevate that factor of motivation.
If you are new to the Himalayas, including the Kanchenjunga Circuit, then starting with Radiant Treks’ map eases your experience. Then, referring to the standard map adds the depth of a professional level. It is all about blending them for a trek that is as smart as it is thrilling.
Kanchenjunga Circuit Trek: Main Stop Points on the Map

Mapping out the Kanchenjunga Circuit Trek feels like piecing together a puzzle of mountains, trails and hidden villages. Using the visual map as your lens, you can break down the route into logical sections. And you can also make use of those icons and altitudes to understand more about the rest points, accommodations and more. Therefore, it is not just about the path. It is how the map spotlights stops, making the journey tangible and less daunting.
Here is an overview of the main stop points as shown on the map, after categorizing them into different phases of the journey:
Entry and Approach Phase
The map kicks things off with Kathmandu at 1,400 meters, flagged by a little airport icon. It is your starting point for stocking up before the real fun begins. From there, a dotted flight line zips you down to Bhadrapur at just 91 meters, then switches to a gray line for the jeep ride up to Phidim (930 meters). Here, a check post symbol pops up as a reminder to sort your permits. It keeps going gray to Sekathum at 1,650 meters, marked with a teal blue starting point dot. This early section shows subtropical vibes through the route’s winding path, hinting at forests and fields without overloading on details.
Northern Arm to North Base Camp
Things get more intense here as the gray line turns solid orange, climbing north from Sekathum through spots like Amjilosa (2,520 meters) and Gyabla (2,730 meters), both dotted teal blue for accommodations. You’ll spot Ghunsa at 3,595 meters as a key hub, with a red H for the health post standing out. The path pushes on to Kambachen (4,050 meters) and Lhonak (4,780 meters), building up to Pangpema North Base Camp at 5,065 meters, topped with a tent. The altitude chart at the bottom of the map graphs the steady rise, showing those early spikes to help you plan rests.
High Passes and Southern Arm to South Base Camp
This is where the map really shines for the tough parts, with the route looping over Sele Le Pass (4,290 meters). It is marked by arrows and climbs to the maximum altitude at 5,140 meters across the passes Sinon La, Mirgin La, and Sine Lapcha La. It then drops to Tseram (3,870 meters) with another blue accommodation dot.
The map shows the route, then branching to Oktang Base Camp at 4,730 meters, again with a mountain symbol for that southern viewpoint. The chart below the map mirrors the ups and downs like a rollercoaster, highlighting those high-elevation days around 10-15 for acclimatization warnings. On the other hand, icons for check posts and health spots remind you of support along this rugged stretch.
Descent and Exit Phase
Winding down, the orange line heads south from Oktang through Torangden (2,995 meters) and Yamphudin (2,080 meters). You see on the map that the route then eases to Khebang (1,910 meters), Khandembe (1,800 meters) and Tharpu (1,600 meters). The trek route ends with the end of the orange line at Tharpu. It then switches back to the gray line for the vehicle’s return to Bhadrapur. And then the flight icon loops you to Kathmandu. Likewise, the descending graph line visualizes the return, with forested paths implied by the gentler curves. Thus, it is great for spotting where to take it easy after the peaks.
Why Kanchenjunga Trek Map

The trekking maps are not just pretty pictures. They’re packed with clues that can make or break your adventure. Here’s some advice on making the most out of a map for the Kanchenjunga Circuit:
Altitude Chart for Packing
Refer to that altitude chart at the bottom of the visual map for smart packing. Trace the line from Day 1’s lowlands around Bhadrapur up to those 5,000-meter spikes near Pangpema. It is a visual cue to pack versatile layers. Throw in breathable shirts for the steamy start, but don’t avoid wool base layers and a solid down jacket for the higher areas where the graph shoots up. In addition, you can mark your copy with notes on where to switch gear, like adding gloves after Ghunsa.
Icons for Trail Logistics
Those icons and symbols on the map are very useful for on-trail logistics. For instance, the red H is for health posts. Circle them as mandatory pauses, especially at spots like Ghunsa or Phidim, to build in acclimatization days and dodge altitude sickness.
You can refer to the chart’s elevation gains to keep your schedule on track. The check post barriers are prompts to prepare permits in Kathmandu. And those signs for passes like Sele La are red flags for weather check. Before you go to this destination, overlay forecasts on the map to avoid getting caught in snow or fog.
Route Lines for Navigation, Safety
Pay close attention to the route lines and symbols on the map. The gray sections for vehicle rides from Bhadrapur to Sekathum remind you to arrange transport ahead. Meanwhile, the orange-colored paths highlight where you’ll be on foot. Use a highlighter to mark potential side trails for flexibility.
Dots for Accommodation
You see dots in teal blue colors at teahouses in places like Tseram or Yamphudin. Support locals by planning your overnights there to minimize camping impact.
Wrapping It Up
The Kanchenjunga Circuit isn’t just a trek. It is a soul-stirring loop through Nepal’s untamed east, and the right map unlocks it all. From raw standards to Radiant Treks’ vibrant visual, they guide you safely amid peaks and valleys. You can download Radiant Treks’ visual map today and step into the adventure.
FAQs

What makes Radiant Treks’ visual map a good reference for the Kanchenjunga Circuit Trek?
Radiant Treks’ map has added icons, color routes and an altitude chart for faster insights into the trek route. It is perfect for visualizing the Annapurna Circuit without getting confused.
How can the map help with altitude sickness prevention?
The labeled elevations and graph show altitude gains clearly. Based on that information, you can plan rest days for acclimatization. This reduces the risk of altitude sickness at higher elevations.
Is the map available digitally or only in print?
It’s versatile – print for your backpack or go digital for apps.
Do I need special permits for the trek, and does the map show them?
Yes, it is mandatory to get restricted area permits. The icons of checkpoints on the map highlight where to show them. Therefore, get the permits arranged in Kathmandu to avoid last-minute hassle.
Can beginners use a map for the Kanchenjunga Circuit Trek?
The route map of Radiant Treks suits newcomers with clear symbols and charts. That said, the trek’s strenuous – pair it with a guided tour for extra safety and expertise.
How accurate is the altitude data on the map?
It is spot-on as the data is drawn from reliable surveys with a maximum elevation of 5,065 meters. It aids tracking with tools like altimeters, ensuring you are prepped for real elevations on the ground.